Likewise, the fewer intersections (merge points) the less delay that induces. This has lead highway planners to minimize intersections, to reduce stop and go traffic. However, the unexpected consequence has been to concentrate traffic at a small number of intersections. However, this has had unexpected consequences. With very large intersections, 'free' left and rights are no longer possible, and so each turn movement has to have a phase. The more phases per cycle, the longer the cycle, and the longer the amount of delay at the intersection. Arguable, better procession along a corridor might be achieved by unifying signal timing for a larger number of small intersections along a corridor.
Traffic lights are typically time for efficient operation at the peak hour, regardless of how inefficient that makes them the rest of the time--where is why you wait for like half an hour at the cross section of a major road at midnight.
The greatest danger for pedestrians are high speeds (more serious injuries, less reaction time for the driver) and exposure time. Exposure time is a function of distance to be crossed: wider intersections are bad.
The speed at which drivers travel is largely a result of the functional geometry of the road: Wide lanes and straight aways induce speeding; narrow lanes and curves slow drivers down.
The optimal road network for drivers and pedestrians (arguable) consists of a network of narrow 1-way roads, with regularly spaced 2-phase intersections (permitted by 1-way roads), where the signals are synchronized. For automobiles, peak speeds are low, but average speeds are good, and intersection delay is minimal. For pedestrians, exposure is more frequent, but for sharply reduced times, and crash severity and frequency are minimized.
Ie, Portland, Manhattan, or the Avenues in Salt Lake City. "The standard block in Manhattan is about 264 by 900 feet (80 m × 274 m); ...the standard square blocks of Portland, Houston, and Sacramento are 264 by 264 feet" (Wikipedia, 'City Block', 10 Dec 2017), and blocks in the Avenues are 330' x 330'.
Sunday, December 10, 2017
Wednesday, October 18, 2017
HOV
Guys, we've got to get serious about HOV/HOT enforcement in Utah. Otherwise, were just encouraging people to cheat. And that just encourages more people to cheat. And then all we have is another over loaded freeway lane.
The purpose of a HOV Lane is to encourage carpooling, by making it faster, to compensate for the hassle of picking up another person. The purpose of a HOV/HOT Lane is to get some value out of underused HOV lanes.
Do we need to sue to demonstrate that the modeled improvements for HOV/HOT are bunk, based on lack of enforcement?
Pretty sure traffic cameras are still illegal in Utah. But the world has moved on since then. Cell phone cameras are ubiqitous. Maybe that's it--we need a cop with a cell phone camera, taking pictures of license plates, matching them to DMV data, and sending a 'warning' by text or mail.
"But it's hard to tell if the HOV is legit!".
Maybe. But that is why there is a cop behind the camera--to exercise human judgment.
Monday, October 2, 2017
Boulder Mountain Highway for Tooele
More and more I am hearing about people commuting from Tooele to downtown SLC and the University of Utah. Housing in Tooele is cheap, because the accessibility to jobs is poor. But transport costs are high, as people are driving long distances. Those long distances are being driven by older cars. (As lower-income HH can't afford new cars). That generates a lot of air pollution.
To me, this calls for an Express Bus from Strasbury to the University of Utah, stopping by downtown along the way. (Perhaps at the State and 200 S. Bus Hub...). Nevada has one from an outlying community to the strip, that is well liked. It costs $5 to ride, but that's comparable to the cost of gas for the trip. (Gas was more expensive, then). Still, 25 miles at 25 miles/gallon is a gallon of gas each way. @ about $2.40/gallon, gas alone would not do it.
Surveys and empirical evidence suggest that most people spend 15% of their budget on transport. (Transit dependent populations spend less, something in the neighborhood of 4%, because it's hard to spend that much money on transit. A ticket is a ticket. Two tickets a day or 4 tickets a day is the near-max*).
Do rider-collection near freeways, using a Park and Ride lot, and then the bus--call it an 'Inter-Urban', as it provides access between towns, rather than within them--takes people to SLC CBD and the University.
UTA likely already has something like this, but it's likely sub-optimal. More capital investment would make it better, but 'flexibility' is assumed to be a necessary virtue of all buses; being unable to change a route at the drop of a hat seems terrible. (Nevermind that same flaw is considered a virtue for trains).
*Makes me wonder if there isn't a market for premium transit, costing slightly more than the regular transit, and offering slightly better service. Or double the price for 150% of service (2/3 the travel time).
Thursday, August 10, 2017
SLC Central Station
UTA's free fare zone map leaves something to be desired.
It shows the TRAX, but not the bus. When I look at the bus map for downtown SLC, there is a lot of service there! UTA might do better just combining the two maps, given their near-identical extents. Here is my MS-PAINT take on such a map: (Gray line with FFZ acronym)

On a proper mapping program, I'd use a specially dashed line, perhaps using arrow symbols. Using a shader or a hash would obscure the information inside the box.
If UTA wanted to move away from a free fare zone, they could designate certain stops or stations, rather than an area.
So... looks like either 200 south or North temple is a really nice place to put a central station. State Street and 200 South, specifically...
Jane Jacob's Density
Great blog post here: "Squeezing Jane Jacobs Density". The comments are also worth a read.
I'd like to do a bit of expository thinking on this bit of text:
....your lower units start losing access to sunlight at 4+ story heights. Even Jacobs notes the disadvantage of coverage that is too high in Chapter 11, discussing the North End in particular. The block on the left side of the North End photo at the top, for example, had 72% building coverage in 1960 - way too high for comfort for her (actually, she called it "intolerable"). That is why it was 123 DUA in that 4-7 story height range.
For most 1-5 acre lots, 60% lot coverage for 6+ story multifamily development is a sober number not to surpass for your development. If you want to hit 150 DUA with this, you will need to go to at least 8 stories to secure adequately sized multi-bedroom units. That's what 150 DUA looks like at a bare minimum with underground parking. If we elect to squeeze 150 DUA into 6 stories instead, we are going to be building too many one bedroom units - exactly what we shouldn't be building, according to Jacobs, if we want to promote diversity! To use her terms, that would "standardize" your development to stamp out diversity.Two topics it brings to my attention: First is the matter of density, building height, and lot coverage. The second is the difference between lot coverage and block coverage.
Density is a bit 'squishy'; it's a zonal measure of intensity, or the number of of things per areal unit. But what thing is used as the metric generates very different results. Population, employment, dwelling units, and square feet/square meters are all used, and the ratio between them is rarely constant. Which is troublesome, as zoning regulates the built environment using all of the above.
I live in a 1.5-story four-plex, which has four units, and 2-3 people per (2 bedroom) unit. So about 10 people. Total square footage (including the shed) is about 3000 SF. My mom's single family suburban houses is a 2.5 story single family detached, with one person in it, and is about 3000 SF. Very different styles of housing. I'd hazard her lot coverage is lower than mine, something like 50% vs. 70%.
My mom could probably triple the number of dwelling units on the lot by refinishing the basement, and add another unit by retrofitting the top floor. (I lived in a large old house that bad been so converted). Parking would be a non-issue, with the garage, RV-pad, driveway, and on-street parking.
Thursday, July 6, 2017
SLC Free Fare Zone
UTA's free fare zone map leaves something to be desired.
It shows the TRAX, but not the bus. When I look at the bus map for downtown SLC, there is a lot of service there! UTA might do better just combining the two maps, given their near-identical extents. Here is my MS-PAINT take on such a map: (Gray line with FFZ acronym)
On a proper mapping program, I'd use a specially dashed line, perhaps using arrow symbols. Using a shader or a hash would obscure the information inside the box.
If UTA wanted to move away from a free fare zone, they could designate certain stops or stations, rather than an area.
Friday, June 30, 2017
Streetcar vs. Automobile in 1917
Free roads and free parking subsidize the automobile. Why not transit?
"Because it benefits so few people--only 3% of people take transit to work".
And how many people took automobiles to work in 1917*?
"..."
That's right. Because we have no idea.
MODE ACCESS
We know that about 30% owned cars. (No idea how many had access to transit--have to find that out someday)

Compare that to the number of people who were riding transit at that time:
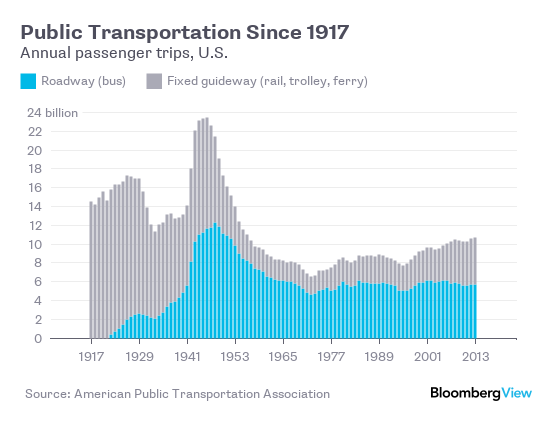 TRIPS MADE
In 1917, there were 14 Billion transit riders, so about 131 transit trips for every person in the United States. Sadly, no data for auto users, so we still can't make an apples-to-apples comparison.
MILEAGE DRIVEN
We have some estimate of how many automobile miles were driven: About 30 billion. Or, for a U.S. population of 106.5 million, about 289 miles a year. With 260 working days in a year, that is about a mile a day.

Data for transit is proving difficult to find, and even APTA doesn't have it for before the 1970's. The best they've got is vehicle miles**: In 1920, there were 1,922 million vehicle miles (1,922,000,000)..but that's just how far the trolleys traveled, not how far the people on board them traveled. Without knowing how many people were on board, we can't compare person-mileage.
*Streetcars reached their apex in 1917, the same year Federal funding of roads started. Whether the Feds just switched to what would have been the winning horse anyway is difficult to know.
** I'm leaving out subways and commuter railways so there can be no "that's just New York" whining.
"Because it benefits so few people--only 3% of people take transit to work".
And how many people took automobiles to work in 1917*?
"..."
That's right. Because we have no idea.
MODE ACCESS
We know that about 30% owned cars. (No idea how many had access to transit--have to find that out someday)
Compare that to the number of people who were riding transit at that time:
In 1917, there were 14 Billion transit riders, so about 131 transit trips for every person in the United States. Sadly, no data for auto users, so we still can't make an apples-to-apples comparison.
MILEAGE DRIVEN
We have some estimate of how many automobile miles were driven: About 30 billion. Or, for a U.S. population of 106.5 million, about 289 miles a year. With 260 working days in a year, that is about a mile a day.
Data for transit is proving difficult to find, and even APTA doesn't have it for before the 1970's. The best they've got is vehicle miles**: In 1920, there were 1,922 million vehicle miles (1,922,000,000)..but that's just how far the trolleys traveled, not how far the people on board them traveled. Without knowing how many people were on board, we can't compare person-mileage.
*Streetcars reached their apex in 1917, the same year Federal funding of roads started. Whether the Feds just switched to what would have been the winning horse anyway is difficult to know.
Urban Phase Shift?
One of the comments on this article was so great I had to repost it:
In pre-industrial (and third world slums) the only access available is by walking, and so some truly hideous densities result.
It's theoretically feasible that a city might stop growing***. But most cities don't--instead, they invest in transportation improvements. NYC built it's first subways in the name of "De-Congestion".
One of the ideas I'm kicking round is an urban scaling induced 'phase shift' in the effectiveness of transportation improvements. Namely, total metro population drives average metropolitan density. (As you get bigger, you naturally get denser). At small sizes and low densities, auto-mobility works: Land is cheap, parking is available, walking anywhere is madness. And it keeps working, as long as your addition of automobile capacity keeps up with congestion.
However, while travel is an 'derived demand' in terms of the number of trips made, it's a 'induced demand' in terms of the length of trips made. If you make traveling cheap and easy, people go further.* Urban form is 'set' by the dominant transportation mode at the time of construction**. So places developed under conditions of auto-mobility tend to be low-density with segregated land-uses. The large amount of travel required to get around for basic needs is 'baked-in' at that point.

from: https://people.hofstra.edu/geotrans/eng/ch6en/conc6en/cellular_automata.html
As the number of zones increases, the average distance from one zone to another also increases. Which means, all else equal, the amount of travel required to get to all the places you want to go also rises. Simply because things are scattered about: home in one place, work in another, groceries in a third, kids-school in a fourth, soccer in another, ballet-practice in another, dentist in yet another.
The big problem is that the increase in average distance between all of these things is non-linear. Every additional 'zone' you add to a city, the average distance rises more than it did for the last zone.
Even if the road lane miles per capita (and associated costs) remain constant, the amount of travel doesn't. As travel demand outstrips supply, congestion results.
Some cities try to fix this increasing congestion with massive increases in road-building. Failure is inevitable. Exponential increases in travel require exponential increases in road capacity, imposing exponential costs on a linearly growing population.
And so at some point, every city gets the 'rapid transit bug'. And it has to be rapid transit, because only rapid transit makes it possible to avoid congestion. Non-rapid transit, such as regular buses and streetcars, are undeniably cheaper to build than rapid transit (sometimes by an order of magnitude).
But that doesn't matter. Rapid transit is premium transit*****. It's transit for choice riders (people who could drive, but choose not to). And to get people to make that choice, it has to be better (in some way) that the driving alternative.
Non-rapid transit suffers from congestion. It's less convenient, less reliable, and less comfortable than your personal automobile. You don't have a 'locker' to store things in, and hauling groceries is difficult. Thus, it can almost never compete with a private automobile (excepting when parking costs/hassles are enormous).****
Rapid transit is better than the personal automobile when it is a) faster, b) cheaper, and c) more reliable. 'a' only happens when congestion is fierce; transit vehicles make repeated stops. 'b' seems simple, but for most people a car is a 'stock' of mobility they can draw upon even with no money, while transit is a 'pay-per-use' thing, so it seems expensive, even if it is less expensive in aggregate. Again, 'c' is reliant on congestion to work.
In summary: Auto-mobility works until it doesn't. It stops working because average travel distances increase exponentially as the metro area expands, while population increases linearly. This makes it impossible to keep expanding roadway capacity to match demand. (Some try; all fail). As travel demand outstrips supply, congestion results.
The total amount of delay drivers experience is exponentially proportional to the amount of congestion (from: https://ops.fhwa.dot.gov/congestion_report/chapter2.htm) The AADT/C ratio is the ratio of traffic to capacity.

-----------------------------------------------------------------------------------------------------------------------
***This may be one of the reasons for competing cities, closer together. When a city reaches maximum walkable density, it makes a great deal of sense to go elsewhere. Of course, large cities have huge advantages in terms of access to resources and agglomeration economies, which (typically) more than offset the cost of congestion. I expect the only time you'd really see such a switch is for 'Twin cities' like Minneapolis-St. Paul, or the Texas MetroPlex.
*The reverse is also true. As congestion increases, trip length should start falling.
**The trouble being that urban form is fixed at date of construction, and is very difficult to retrofit for alternative transportation modes. Adding highways to NYC came at enormous financial and social cots. Retrofitting auto-dependent cities will likely be painful/costly as well.
****Which is why buses to downtowns, Universities and hospitals work--they are all places with terrible parking.
*****The political quid-pro-quo of rapid transit for dependent riders is that "Hey, you too can ride the premium transit!". The flip side to that is that the high cost of rapid transit means less of it is provided--its goes fewer places. Typically, bus operations get cut to pay for capital improvements, which leaves the transit-dependent population worse off.
When I took my Urban Economics course from Barton Smith, one of the observations Smith told us in class was that whenever prices for major goods and services in an urbanized area keep going up (and housing is certainly a big part of most people's budgets), eventually prices will reach a point where they will become a market signal to everyone that the urbanized area needs to stop growing. Population growth will either come to a halt, or people will start leaving until prices fall to an equilibrium where people can afford to live there again. - Neil MeyerI think it gets to the core of why city promoters like transportation improvements--without affordable housing, cities can't grow. Affordable housing includes both rents and access costs. As rents in one area rise, people can offset that by moving to nearby areas with lower rents (and higher access costs).
In pre-industrial (and third world slums) the only access available is by walking, and so some truly hideous densities result.
It's theoretically feasible that a city might stop growing***. But most cities don't--instead, they invest in transportation improvements. NYC built it's first subways in the name of "De-Congestion".
One of the ideas I'm kicking round is an urban scaling induced 'phase shift' in the effectiveness of transportation improvements. Namely, total metro population drives average metropolitan density. (As you get bigger, you naturally get denser). At small sizes and low densities, auto-mobility works: Land is cheap, parking is available, walking anywhere is madness. And it keeps working, as long as your addition of automobile capacity keeps up with congestion.
However, while travel is an 'derived demand' in terms of the number of trips made, it's a 'induced demand' in terms of the length of trips made. If you make traveling cheap and easy, people go further.* Urban form is 'set' by the dominant transportation mode at the time of construction**. So places developed under conditions of auto-mobility tend to be low-density with segregated land-uses. The large amount of travel required to get around for basic needs is 'baked-in' at that point.
This is problematic, if the metropolitan area keeps expanding.

from: https://people.hofstra.edu/geotrans/eng/ch6en/conc6en/cellular_automata.html
As the number of zones increases, the average distance from one zone to another also increases. Which means, all else equal, the amount of travel required to get to all the places you want to go also rises. Simply because things are scattered about: home in one place, work in another, groceries in a third, kids-school in a fourth, soccer in another, ballet-practice in another, dentist in yet another.
The big problem is that the increase in average distance between all of these things is non-linear. Every additional 'zone' you add to a city, the average distance rises more than it did for the last zone.
Even if the road lane miles per capita (and associated costs) remain constant, the amount of travel doesn't. As travel demand outstrips supply, congestion results.
Some cities try to fix this increasing congestion with massive increases in road-building. Failure is inevitable. Exponential increases in travel require exponential increases in road capacity, imposing exponential costs on a linearly growing population.
And so at some point, every city gets the 'rapid transit bug'. And it has to be rapid transit, because only rapid transit makes it possible to avoid congestion. Non-rapid transit, such as regular buses and streetcars, are undeniably cheaper to build than rapid transit (sometimes by an order of magnitude).
But that doesn't matter. Rapid transit is premium transit*****. It's transit for choice riders (people who could drive, but choose not to). And to get people to make that choice, it has to be better (in some way) that the driving alternative.
Non-rapid transit suffers from congestion. It's less convenient, less reliable, and less comfortable than your personal automobile. You don't have a 'locker' to store things in, and hauling groceries is difficult. Thus, it can almost never compete with a private automobile (excepting when parking costs/hassles are enormous).****
Rapid transit is better than the personal automobile when it is a) faster, b) cheaper, and c) more reliable. 'a' only happens when congestion is fierce; transit vehicles make repeated stops. 'b' seems simple, but for most people a car is a 'stock' of mobility they can draw upon even with no money, while transit is a 'pay-per-use' thing, so it seems expensive, even if it is less expensive in aggregate. Again, 'c' is reliant on congestion to work.
In summary: Auto-mobility works until it doesn't. It stops working because average travel distances increase exponentially as the metro area expands, while population increases linearly. This makes it impossible to keep expanding roadway capacity to match demand. (Some try; all fail). As travel demand outstrips supply, congestion results.
The total amount of delay drivers experience is exponentially proportional to the amount of congestion (from: https://ops.fhwa.dot.gov/congestion_report/chapter2.htm) The AADT/C ratio is the ratio of traffic to capacity.

-----------------------------------------------------------------------------------------------------------------------
***This may be one of the reasons for competing cities, closer together. When a city reaches maximum walkable density, it makes a great deal of sense to go elsewhere. Of course, large cities have huge advantages in terms of access to resources and agglomeration economies, which (typically) more than offset the cost of congestion. I expect the only time you'd really see such a switch is for 'Twin cities' like Minneapolis-St. Paul, or the Texas MetroPlex.
*The reverse is also true. As congestion increases, trip length should start falling.
**The trouble being that urban form is fixed at date of construction, and is very difficult to retrofit for alternative transportation modes. Adding highways to NYC came at enormous financial and social cots. Retrofitting auto-dependent cities will likely be painful/costly as well.
*****The political quid-pro-quo of rapid transit for dependent riders is that "Hey, you too can ride the premium transit!". The flip side to that is that the high cost of rapid transit means less of it is provided--its goes fewer places. Typically, bus operations get cut to pay for capital improvements, which leaves the transit-dependent population worse off.
Thursday, June 29, 2017
How does the WFRC model deal with trip chaining?
Was drafting a blog post on trip lengths vs. trip frequency, and the though struck me:
We know that the evening peak is longer and 'lower' than the morning peak. I think that's because people run errands after work (rather than before work).
Economically speaking, as congestion worsens, the average amount of distance per unit of time falls. As the cost of that time rises, people travel less. I'm thinking that the way people travel less is by chaining trips together.
The home to work journey is typically the longest people make. Assuming that journey is the hypotenuse of a triangle, the maximum journey of chained trips is an equilateral triangle. Given the triangle inequality (the sum of two sides is always greater than the third), the minimum diversion is tiny. Looking at the maximum diversion, the greatest distance from the hypotenuse is radical(3)* the hypotenuse, or about 87% of it. So for any trip up to 87% of the distance of your work trip, it makes sense to chain that trip with the work trip.
I know the WFRC model has HBW, HBO...but is there a WBO (Work-based other)? Or does that just get rolled into the HBW?
BRT vs. Traffic Lane, Part 3
Continuing our series on BRT vs. Traffic Lane (Part 1, Part 2), another exploration how how the two compare. Mike Brown observed that:
Mike came up with the following numbers:

I'll add a few comments to what Mike has said.
1) I don't think it's physically possible to run 60 buses an hour, even dedicated bus pullouts. That would require a bus to decelerate, board, rejoin traffic, and accelerate. Even with elevated platforms, off-board fare collection and multi-door boarding, I think that would be a hard standard to achieve. And even one late bus would make all the buses in the queue later, and congestion would ripple down the line.
The really serious BRT routes (Gold Standard) have four lanes: A curbside lane (to reduce time spent re-entering the travel lane) used for boarding, and a bypass lane. This seems to permit operations at headways as low as a minute and a half. But that would be four lanes, and outside our scope of analysis. Hit with capacity constraints, the current solution is to make a bus more train-like, but adding another unit, using double-articulated buses rather than just articulated buses. Double-articulated buses with capacities up to 180 are currently in use in Utrecht. Volvo has a 300 person capacity bus that is being tested on the TransMilenio.
2) Rare is a system that could load such a bus so heavily. But it might be possible. Daily ridership on route 830 (the route that the Provo-Orem BRT is to replace) reached 3,000 per day. The BRT was projected (in 2011) to have 12,900 daily riders. Assuming 10% of ridership takes place in the hour of the morning peak., that's 1,290 riders. Assuming the planned five minute headway is used, that's about 107 riders per bus. Or course, they won't all be on the bus at the same time. But it does suggest that the Provo-Orem BRT will be pretty heavily used. In 2030, the BRT is projected to have 16,100 daily riders, or about 137 riders per bus. Again, they won't all be on the bus at the same time.
3) BRT does scale better. Moving to a double-articulated bus would boost capacity to 120. At five minute headway, such a bus could carry 1400 persons per direction per hour , greater than a major arterial at 5pm. Alternately, just adding 3 more buses (to boost headway to once every 4 minutes an hour) increases it to 1400 persons per direction per hour. A bus every four minutes seems like something a single lane could manage. TRAX puts a train through an intersection every 5 minutes regularly (400 S. and Main). On 'crush load' (game) days, it might be as high as double that.
4) Branded Bus Corridors are a great idea. But they are only as long as the 'rainbow' portion of the corridor, where multiple lines overlap. Beyond that, you have to transfer. TRAX is a 'rainbow' corridor from 2100 South to Courthouse station. For trains with limited amounts of guideway, service laps are almost inevitable. But for buses, I'm not sure about inter-lining services: Does it just add more confusion? I think it only really works when buses are converging on a termini. I don't see it on the Salt Lake County or Utah County map, but you can see where one should be branded on the downtown Salt Lake Map: State Street from 5th South to North Temple, and thence west along North Temple to 300 West. All of North Temple could be branded, and both 200 South and 400 South might also be candidates.
5) The key question is not "Will the buses be full?" but "When will the pavement carry more people as a bus lane than as an automobile lane, during the peak hour." Not at five minute headway and 90 person loads, but at 100 persons/bus (at 5 minute headway) or 80 persons per bus (4 minute headway), a bus edges ahead. Based on the 2030 numbers, it seems likely that a BRT is a better long-term investment than a traffic lane.
6) A full discussion on automated vehicles is going to require a full blog post.
- A 5-minute, fully loaded BRT would carry about as many people as a standard Arterial lane
- Unless you can trust that you can fully load each bus for an hour, then a 5-minute BRT will not move as many people as standard cars would.
- That's not necessarily a reason to go with cars. Cars create car dependency, and they max out in what they can carry, but BRT can be increased to more than 5-minutes.
- "BRT" need not be a single route. In many downtowns, some block segments have a bus each minute, and sometimes more often.
- Dedicating a lane exclusively to buses in these cases will result in more people per lane, assuming most buses are quite full.
- If automated vehicles and vehicle sharing begin to overtake private ownership, it is possible to imagine lanes where auto occupancy might reach 4 or more passengers carried in "minivan"-type vehicles. In this "jitney-like" transit scenario, lanes even outside downtowns can start to carry far higher numbers than 5-minute suburban BRT," which is very aggressive service for suburbs.
Mike came up with the following numbers:

I'll add a few comments to what Mike has said.
1) I don't think it's physically possible to run 60 buses an hour, even dedicated bus pullouts. That would require a bus to decelerate, board, rejoin traffic, and accelerate. Even with elevated platforms, off-board fare collection and multi-door boarding, I think that would be a hard standard to achieve. And even one late bus would make all the buses in the queue later, and congestion would ripple down the line.
The really serious BRT routes (Gold Standard) have four lanes: A curbside lane (to reduce time spent re-entering the travel lane) used for boarding, and a bypass lane. This seems to permit operations at headways as low as a minute and a half. But that would be four lanes, and outside our scope of analysis. Hit with capacity constraints, the current solution is to make a bus more train-like, but adding another unit, using double-articulated buses rather than just articulated buses. Double-articulated buses with capacities up to 180 are currently in use in Utrecht. Volvo has a 300 person capacity bus that is being tested on the TransMilenio.
2) Rare is a system that could load such a bus so heavily. But it might be possible. Daily ridership on route 830 (the route that the Provo-Orem BRT is to replace) reached 3,000 per day. The BRT was projected (in 2011) to have 12,900 daily riders. Assuming 10% of ridership takes place in the hour of the morning peak., that's 1,290 riders. Assuming the planned five minute headway is used, that's about 107 riders per bus. Or course, they won't all be on the bus at the same time. But it does suggest that the Provo-Orem BRT will be pretty heavily used. In 2030, the BRT is projected to have 16,100 daily riders, or about 137 riders per bus. Again, they won't all be on the bus at the same time.
3) BRT does scale better. Moving to a double-articulated bus would boost capacity to 120. At five minute headway, such a bus could carry 1400 persons per direction per hour , greater than a major arterial at 5pm. Alternately, just adding 3 more buses (to boost headway to once every 4 minutes an hour) increases it to 1400 persons per direction per hour. A bus every four minutes seems like something a single lane could manage. TRAX puts a train through an intersection every 5 minutes regularly (400 S. and Main). On 'crush load' (game) days, it might be as high as double that.
4) Branded Bus Corridors are a great idea. But they are only as long as the 'rainbow' portion of the corridor, where multiple lines overlap. Beyond that, you have to transfer. TRAX is a 'rainbow' corridor from 2100 South to Courthouse station. For trains with limited amounts of guideway, service laps are almost inevitable. But for buses, I'm not sure about inter-lining services: Does it just add more confusion? I think it only really works when buses are converging on a termini. I don't see it on the Salt Lake County or Utah County map, but you can see where one should be branded on the downtown Salt Lake Map: State Street from 5th South to North Temple, and thence west along North Temple to 300 West. All of North Temple could be branded, and both 200 South and 400 South might also be candidates.
5) The key question is not "Will the buses be full?" but "When will the pavement carry more people as a bus lane than as an automobile lane, during the peak hour." Not at five minute headway and 90 person loads, but at 100 persons/bus (at 5 minute headway) or 80 persons per bus (4 minute headway), a bus edges ahead. Based on the 2030 numbers, it seems likely that a BRT is a better long-term investment than a traffic lane.
6) A full discussion on automated vehicles is going to require a full blog post.
Tuesday, June 27, 2017
In Defense of Land Use Regulation
Arguably, any public regulation of land, by limiting the either the use or potential use a land-owner can make of the land. Yet a total lack of regulation of land is neither fair nor reasonable, as things which happen on your neighbors property directly affect yours. The oldest case would likely be mandatory building set-backs so as to provide fire-breaks. More recent cases would be 'public nuisances'; if your neighbor begins to use their garage as a concert space, the whole neighborhood suffers from the sound, while receiving none of the benefit. *
*I joined the 'Market Urbanism' group on Facebook, because I'm interested in congestion pricing and dynamic pricing for parking. Instead, I find myself engaged in debates about the virtues/values of land-use regulation. (As an urban planner, I'm generally for it). But it is forcing me to sharpen my rhetorical skills, so I suppose that's a plus.
*I joined the 'Market Urbanism' group on Facebook, because I'm interested in congestion pricing and dynamic pricing for parking. Instead, I find myself engaged in debates about the virtues/values of land-use regulation. (As an urban planner, I'm generally for it). But it is forcing me to sharpen my rhetorical skills, so I suppose that's a plus.
No new freeway will reduce pollution
Adding a new freeway will never reduce pollution, because that does not reduce vehicle miles traveled. Vehicle miles traveled generate half the air pollution in SLCo. Adding more miles traveled will not help.
Our air quality fails twice yearly: pm2.5 (winter) and ozone (summer). We are in "Serious Non-attainment". Which means we may lose all Federal funding for me roads. (The feds pay for 80 percent of new freeways.) Only California and Phoenix are in similar circumstances. Note that both, after decades of freeway expansion, are now engaged in huge programs of transit construction. This suggests the same will occur in Utah.
It is unlikely freeway construction will stop. But it is likely that what will be built will not be grade separated freeway. Rather, the most expensive part of new freeways (interchanges) will be omitted or delayed. Hence, most new roads will be more like Bangerter highway, with innovative intersections rather than interchanges.
Alternately, more like Mountainview corridor: phased segments and widths. A sort of boulevard treatment for a freeway. First, the access lanes (frontage roads) get built (as minor arterials) with a big space left in the middle. And then the freeway lanes in the middle get built.
In any case, the 'surge' of additional mobility historically generated by a new freeway is likely gone for good. And hence the massive profits from developing farmland. The land value uplift will still take place, but at a slower and more gradual rate.
The market knows this, even if it doesn't know it knows. The price of 'raw land' in the county, (even marginal and difficult to develop land) is rising like mad. And housing pricing reflects this. New houses typically cost 5x the cost of the land. So as land prices rise, either new houses get more expensive, or lot sizes fall. I think we see both happening.
Friday, June 23, 2017
Public Policy always implies subsidy--either to someone, or to their competitors.
Reading Peter Gordon's blog always reminds me that all public policies imply subsidies--either to someone, or to someone's competitors.
When they began, our health and safety regulations are a 'subsidy' for companies already engaging in them. The Dodd-Frank Act on banking is often decried as a subsidy for big banks, because the cost per customer of compliance is lower than for smaller banks.
My friend Rob refers to me as a 'Parking Republican' as I have zero issue with pricing either parking or roads. And why not? It's fiscally sound and economically efficient. Von Thunen pointed out that there is always direct trade-off between rents (real estate) and transportation costs, and the whole field of urban economics is based on it. As a nation, we invested piles of money in lowering transportation costs (adding roads). This massively lower the cost of transportation, which then massively lowered the cost of urban land. (Hence turning central cities into slums for a fifty years).
Free roads and free parking subsidize the automobile. Why not transit?
SLC Transit Master Plan: Community Outreach
Today, we look at the Community Outreach appendix.
- It would be nice to have documented the timespans of the outreach events, as well as the dates.
- Please don't use pie-graphs: they are inferior to bar graphs for comparison, even for percentages.
- A summary of the routes/corridors most indicates in the 'Mapping Excercise' to display density of suggested improvements would have been a nice way to display where the focus of concern/interest was.
- Detailing the methodology (budget of allocated points) for the conversation boards would be welcome.
- Some way of aggregating rankings would be welcome. Something like a Borda Count would work; viz: "The Borda count determines the outcome of a debate or the winner of an election by giving each candidate, for each ballot, a number of points corresponding to the number of candidates ranked lower". This would be a substantial improvement over language like "25 percent chose this option as their primary consideration", an approach which entirely disregards the importance of secondary and tertiary preferences.
- "LIMITED neighborhoods" needs defined earlier than page 27; the appendix should stand on its own. The idea of such neighborhood also merits greater discussion--transit dependent older adults who are either unable to drive or afford driving, but who live in autocentric neighborhoods.
SLC Transit Master Plan: Gap Analysis
Today, Appendix C: Gap analysis
First, some umbrage:
First, some umbrage:
- Transit Use: Currently, 6% of Salt Lake City residents take transit to work.
- Transit Service and Connections: More bus service is provided than service on any other modes, but evening and weekend transit service is limited. Capacity constraints and limited layover space are limiting to transit service.
- Transit Performance: Transit boardings in Salt Lake City increased since 2011, but at a slower rate than the system as a whole and at a slower rate than service hours.
- Access and Amenities: Large block size and other barriers makes first/last mile access to transit difficult.
- Eighty-three percent of bus stops do not have a bench or a shelter for people to wait for the bus to arrive
The map on C-2 needs work. The same is generally true of many of the other maps. The iconography used to represent boardings is confusing: why two circles? Secondly, the scaling on the circles should be changed to a different magnitude: the resulting cirles are too large.
The 'Transit Propensity Index' (TPI) being used is junk science. Gallingly, it fails to control for transit stations. While activity density (jobs+residents per acre) is a useful metric, the TPI pays no attention to transit service, which is a far more important characteristic in determining ridership. (You can't take a bus that doesn't exist). I strongly recommend moving to a 'Direct Demand' or 'Direct Ridership' model.
There are huge numbers of boardings in some low density locations...because that is where the TRAX stations are. Then there is a lack of boardings in the surrounding area, because why on earth would you wait for a bus when you can walk the 2-3 blocks twice as fast? Rapid transit stations often generate such 'transit shadows' over nearby areas.
Regarding transit mode share, I strongly recommend the article "Transit commuting, the network accessibility effect, and the built environment in station areas across the United States" (2017). I've summarized the conclusions here.
I take umbrage with the statement that: "Of Salt Lake City’s 44 bus routes, only six
routes operate service that is available every 15 minutes
or less". Different bus routes serve different markets (express, coverage, flex, etc) and not all routes should be frequent service routes. Assuming a Frequent Transit Network (FNT) spaced every 2-3-4 blocks:
North-South Routes
Foothill Boulevard
23rd East
13th East
9th East
5th East
State Street
Main Street
4th West
Redwood Road (17th West)
East-West Routes
21st South
17th South
13th South
9th South
4th South (TRAX)
1st/2nd South
That's 15 routes. Holding all routes to the FTN standard (as Figure C-7) does is inappropriate and distortive.
Travel Time Ratios
Regarding Figure C-13: Not sure why the Salt Palace was used. And which gate? I assume the 100 south and West temple gate (as that is what Google gives me). That's a block from TRAX, which is going to add 5-7 minutes to all travel times. It should be a direct shot, streetcar to TRAX. Google maps from: "Salt Palace Convention Center, 100 S W Temple, Salt Lake City, UT 84101" to
"Sugar House Shopping Center, 2274 S 1300 E, Salt Lake City, UT 84106", arriving at 5pm, gives me very different numbers: 40-51 minutes, depending on my selected route.
Service Stability
The draft report notes that
"Service Stability UTA has the option of making changes to their system three times per year, which creates uncertainty about system stability and undermines the City’s ability to organize growth around transit".
While undeniably true, it's a bit of a cheap shot. UTA is funded by sales tax revenue, for something like 3/4 of it's budget. Sales tax revenue fluctuates, and when it falls, UTA must cut service. If Salt Lake City wants to get serious about funding permanent transit around which development can be organized, a special taxation district is almost a necessity. It's not a novel approach--it's how both Portland and Seattle funded their respective streetcars.
Affordability
The cost of transit is most burden some for short trips. Paying $2.50 to travel four miles seems reasonable; paying $2.50 to travel 4 blocks is not. Yet one of the most valuable things a transit system can do in a CBD is act as a 'pedestrian extender'. The Free Fare Zone policy reflects this.
It would be feasible for SLC to cooperate with UTA to insititute a 'zonal' system where trips within SLC are prices differently than those across SLC boundaries, with discounted tickets/passes for the former.
Predicting Mode Share
Renne, John L., Hamidi, Shima and Ewing, Reid (2017) "Transit commuting, the network accessibility effect, and the built environment in station areas across the United States", forthcoming in 'Research in Transportation Economics' is a great article. I've taken the liberty of reproducing some of the relevant results here. (I've removed the discussion of significance, which is more relevant to academics rather than practicioners)
At the Neighborhood Level
I feel that, given these numbers, it should be possible to do a benefit-cost analysis for all of these things....
At the Regional level:
At the Neighborhood Level
- A doubling of the average household income across the station area results in a 17.7% decline in transit commuting
- A doubling of the intensity of jobs and people yields a 17.5% increase in transit commuting.
- A doubling in the share of nonwhites across the station area yields a 14.4% premium for transit commuting.
- Light rail/streetscar (vs bus) increases ridership by 22.5%
- Heavy rail/metro increases ridership by 30.6% over a bus.
- land-use mix is captured by the jobs-population balance index, which indicates that neighborhoods with more balanced land uses exhibit higher shares of transit commuting. A doubling of the values in this index yields a 23.2% increase in the mode share for transit commuting.
- Doubling the number of 4-way intersections increases transit commuting by 9%
- Doubling the walk-score increases transit commuting by 27.6%
- Doubling in transit service frequency yields an 18.6% bonus for the mode share of transit commuting.
- For a doubling in the share of Hispanic residents, transit commuting decreases by approximately 12%.
I feel that, given these numbers, it should be possible to do a benefit-cost analysis for all of these things....
At the Regional level:
- A doubling in the share of regional jobs and population within a half-mile of all stations in the region, also known as the network effect, yields a 38.6% increase in the mode share of transit commuting in station areas.
- For each doubling in annual travel delay, the average share of transit commuting increased by 91%-124%,
Thursday, June 22, 2017
SLC Transit Master Plan: Things I am completely jazzed about
These are all good ideas:
- 200 S—Key East-West corridor, and possibly, future bus rapid transit and/or streetcar) corridor between downtown and the University.
- State Street/500 E/900 E—north-south enhanced bus corridors spaced about a half mile apart extending from southern city limits through downtown to major destinations, including the State Capitol and LDS Hospital, and into the Avenues neighborhood.
- 400 S—continuous east-west bus corridor between Redwood Road and the University.
- 900 S and 1300 S/California— continuous east-west cross-town bus corridors in the center of the city, including service to the Poplar Grove and Glendale neighborhoods.
- TRAX light rail improvements—capital improvements to resolve capacity issues that preclude direct service between the Airport and the University.
- Regional access corridors—support regional transit on corridors such as Redwood Road, Foothill Blvd, and Beck Street (to South Davis County).
With this material, you get a real feel for what SLC is proposing. A 'super-grid' of frequent transit vehicles, stretching accross the city. The longest gap is 400-900 south, so you would (as most) be five blocks from a Frequent Transit Network (FTN) route. I find it really odd that they left 1300 East off that list....
I'm excited at the idea of a 400 S. Transit corridor from redwood to the U. I'm a bit wary it will duplicate the TRAX along 400 South. Stetching corridors accross the city looks good to me.
SLC Transit Master Plan: More Executive Summary Commentary
See here
Page 17 says:
Second, using Uber/Lyft to patch transit doesn't work very well. I understand the desire--use transit for the line-haul portion of the trip, and then Lyft/Uber for the last mile. It can be done, but it's not great. Getting a Lyft/Uber outside of the central city means a long wait, and the drivers aren't as good. For some areas, you can forget ever getting one. It's also expensive. The 'flag-drop' to start a ride on either is about two bucks ($2) and higher in peak times; it runs about $6 to travel a mile, or $12-15 to travel 3 miles.
"Let's hire a taxi for everyone too far from the bus!" is not a solution.
There is also an equity concern: Transit dependent riders may not have smart phones or credit cards. While you can hail a taxi (contrary to widespread public belief), being able to do so is no guarantee of there being a taxi to hail, especially at peak times.
Low density residential areas probably should not have transit. Some low density residential areas have great transit, because they are on the way. That same degree of service can't be extended to everywhere.
Page 17 says:
"Employer-oriented shuttle services in West Salt Lake City and on-demand ride services in low density residential areas connect to the FTN".First, the idea of 'employer oriented shuttle services' doesn't pass the smell test for me--no example is presented. Which employers? Are they going to pay for the service? If not, why do they get special transit service? Who is going to provide the service, UTA, or is SLC going to start buying buses?
Second, using Uber/Lyft to patch transit doesn't work very well. I understand the desire--use transit for the line-haul portion of the trip, and then Lyft/Uber for the last mile. It can be done, but it's not great. Getting a Lyft/Uber outside of the central city means a long wait, and the drivers aren't as good. For some areas, you can forget ever getting one. It's also expensive. The 'flag-drop' to start a ride on either is about two bucks ($2) and higher in peak times; it runs about $6 to travel a mile, or $12-15 to travel 3 miles.
"Let's hire a taxi for everyone too far from the bus!" is not a solution.
There is also an equity concern: Transit dependent riders may not have smart phones or credit cards. While you can hail a taxi (contrary to widespread public belief), being able to do so is no guarantee of there being a taxi to hail, especially at peak times.
Low density residential areas probably should not have transit. Some low density residential areas have great transit, because they are on the way. That same degree of service can't be extended to everywhere.
SLC Transit Master Plan: More Executive Summary
Looking at the Executive Summary again.
It says:
Secondly, anyplace you have an 'end of line' you need someplace to store transit vehicles. This is especially true of places with high 'peak' loads (morning/evening/event). So many buses wind up at the Central Station because the Central Station has a place to store them. I asked someone at UTA how much land it takes for a bus center, like the ones at TRAX stations, and was told 2-3 acres. That's a lot of land.
Third: Transfers are actually a good thing, as Jarrett Walker point out. Essentially, with a fixed budget, you can choose longer waits but direct service, or shorter waits with a transfer. Research shows that transit riders hate waiting even more than they hate transferring.
I am all for the Frequent Transit Network (FTN). Higher frequency means shorter wait times. But frequent transit is always going to be in limited supply, because high frequency comes at the cost of coverage. That means only a few corridors are going to get it, which means most streets aren't going to get it. The street grid is irrelevant in this regard.
It says:
Why a Grid Network? Salt Lake City’s existing, centralized hub model is effective for regional connections but is inefficient for some local trips. Currently, many of UTA’s routes terminate at Central Station, which provides good connectivity to commuter rail service, but creates challenges for people who need to travel to other destinations throughout the city, necessitating multiple transfers and/or indirect trips. The FTN builds on Salt Lake City’s strong street network grid.This concerns me a bit, because it displays a lack of understanding about transit operations. Many routes terminate at the central station, because that's where UTA has a facility. Bus drivers, like other employees, get breaks and need to use the bathroom. UTA has a break room at Central Station for that reason.
Secondly, anyplace you have an 'end of line' you need someplace to store transit vehicles. This is especially true of places with high 'peak' loads (morning/evening/event). So many buses wind up at the Central Station because the Central Station has a place to store them. I asked someone at UTA how much land it takes for a bus center, like the ones at TRAX stations, and was told 2-3 acres. That's a lot of land.
Third: Transfers are actually a good thing, as Jarrett Walker point out. Essentially, with a fixed budget, you can choose longer waits but direct service, or shorter waits with a transfer. Research shows that transit riders hate waiting even more than they hate transferring.
I am all for the Frequent Transit Network (FTN). Higher frequency means shorter wait times. But frequent transit is always going to be in limited supply, because high frequency comes at the cost of coverage. That means only a few corridors are going to get it, which means most streets aren't going to get it. The street grid is irrelevant in this regard.
SLC Transit Master Plan: Executive Summary Comments
Good day to you.
Just a few comments on the executive summary:
- Competing with the automobile for travel times requires rapid transit (BRT or LRT). Any transit vehicle has 'terminal time' associated with stopping to pick up/drop off passengers. Hence, a bus will always be slower than a car. The only way a transit vehicle can make up the difference is if it can avoid automobile congestion with dedicated right of way. UTA requires 26' of ROW for a light rail, and something like 20' for a BRT. The only road on the east bench that can support that is Foothill Drive.
- By your own analysis, most of your riders are Millennials. They walk a lot, and don't mind doing it. Suit stop spacing to them.
- Everyone walks to transit. You can increase walking distances to stops if you make the walk to transit easier (sidewalks in good repair, crosswalks striped) and have someplace to sit down while waiting. This is especially critical for the elderly.
- Speaking of waiting at stops, the part of the transit trip riders hate the most is waiting for the bus. The literature suggests that transit equate 1 minute of wait to four minutes in in-vehicle time. Please prioritize reductions in wait times through increased frequency.
- The main trouble with current east-west connections is that passing through downtown stinks. There is no good way to get from University to Gateway/Farmers Market area by transit. (And believe me, I have tried). The 400 South TRAX is never going to happen, so please prioritize investments on 200 South. Greater frequency on Saturday would be very welcome.
- Please stop using 'Journey to Work' data aggregated to the city level. It's a very serious methodological error: First, there is Modifiable Areal Unit Problem: The average of all the census tracts is very very different from the average of census tracts. Secondly, it's geography of aggregation is the place of residence, not the place of work. So it only refers to workers who live in SLC, not those who commute TO SLC.
- The talk of shuttles on page 17 really concerns me. Shuttles are really expensive to run, and there are only three cases where there implementation is successful: Connecting peripheral surface parking lots to high density activity centers, hospital/university campuses, and 'Google Buses'. Uses them as 'transit extenders' is nonsense.
- Last I heard, UTA had bought the spur-line on 400 West, to deal with the capacity issue. This is not discussed, and is a glaring omission.
- The lack of discussion on UTA's proposed 'Central Bus Hub' at 200 South and State is another glaring omission.
SLC Transit Master Plan: Appendix D Commentary: Open Letter
Guys,
This is bleak:
"Coverage rather than speed is the goal for the local network. Stop spacing as close as 600 feet can be acceptable in some cases".
It is also nonsense. I have zero issue with buses making special 'courtesy stops' for the elderly or disabled, but providing bus stops every 600' diffuses riders, meaning buses have to stop more often, which means buses are slower, which means fewer people ride them. (The #2 bus through downtown is already my personal bete noir.)
Jarrett Walker does an excellent job of explaining why spacing stops so closely is bad. To quote:
"transit planners generally observe that the walking distance that most people seem to tolerate — the one beyond which ridership falls off drastically — is about 400m (around 1/4 mi) for a local-stop service, and about 1000m (around 3/5 mi) for a very fast, frequent, and reliable rapid transit service"
A quarter mile is 1,320. I understand the impetus for the small stop spacing: Coverage is a valid goal. But there are trade-offs associated with it, namely duplicate coverage (when an area has coverage from two areas).
Again, to quote Mr. Walker:
UTA is 'stingy' with service for just these reasons. There is not point in have empty buses, even if they stop every block. Those buses could be better used elsewhere. UTA does have legal 'coverage' requirements from the FTA, saying that it can't cut routes to low-income/minority communities.
UTA also strives to maintain 'equity' in their service provision, so that service miles provides in a city is proportional to the subsidy provided by that city. It has to--as a public authority, it is beholden to its member cities. If SLC wants more transit, it's going to have to pony up more money.
Thank you for your time and attention.
Respectfully,
Matthew Miller
outlooktower.blogspot.com
outlooktower.blogspot.com
SLC Transit Master Plan
SLC has a transit master plan out, with what seems undue haste. (I missed the comment period, and I am what one might called 'engaged' on the topic, being both a transit planner and a SLC Citizen.
Check it out here.
Looks like it was started in 2015, which public data collection done in mid-2015. And is just being released now? I know SLC lost it's transportation director, but the 'hang-fire' on this makes me wonder if there isn't something else going on, politics-wise.
Check it out here.
Looks like it was started in 2015, which public data collection done in mid-2015. And is just being released now? I know SLC lost it's transportation director, but the 'hang-fire' on this makes me wonder if there isn't something else going on, politics-wise.
Tuesday, June 13, 2017
Rail Transit
Rail Transit makes sense where there is an existing rail corridor. Outside of that, not sure it does. Last mile links might count. But those tend to grow, into their own corridors. Any end of line location needs a place to store vehicles (which is why Central bus depots are terrible). So a rail line call never naturally terminate in a CBD--it must pass through.
That said, for single line networks, the terminal station can store one train, and operate such that when a train on one track arrives, the train on the other track departs, so there is always a track available for an arriving train. Trax operated this way for years. Now days, UTA builds long tail track at termini to store trains. Which works at peripheral locations, but not for a CBD location.
Tuesday, June 6, 2017
Mall Sites as Major Redevelopments?
I'd known UTA had a fetish for connecting to Salt Lake Community College campuses. But I hadn't realized how many malls they reach.
The last few months, I've been making use of TRAX to visit City Creek Center. Last month, I took the FrontRunner to Station Park at Layton. Last week I realized that Valley Faire mall is on the green line. And, of course, Gateway has been connected to TRAX for years. And the shops at Traverse Ridge are planed to get a station in the near future. The Provo Orem BRT will reach both University Mall in Orem, and the Provo Town Center Mall.
On one level, I really like it. In terms of shopping and transit, malls are way more walkable than strip-centers. On another level, I wonder if UTA doesn't have long-term redevelopment plans. Malls in America are not doing well--we built too many of them in the first place, and then Amazon has slaughtered them. So the question becomes: How to re-purpose malls, and their acres upon acres of surface parking?
Business Insider suggests a variety of novel uses. You will recognize most of them as the same businesses that are now making uses of derelict strip malls. Like the hermit crab, low-rent land uses will use any available shell. (Smoke shops, nail salons, and architect's offices are reliable indicators).
But personally, I'd rather see most most of the parking redeveloped. Malls are typically located in premium locations near freeway interchanges, and that's a hard location to beat for new offices. Transit access only improves the location.
Even better would be to phase things. Keep the mall, but remove some parking. Start with a few office buildings (with reduced parking requirements due to transit access). Keep that up until the additional nearby activity perks up the malls retail a bit. Then start adding some high-rise residential: Good freeway access, good transit access, retail/services nearby, and you might be able to walk to work!
MAUP-ing it up.
Geographers are well aware of the Modifiable Areal Unit Problem (MAUP). Basically, MAUP causes the results to change when you change the unit of aggregation. This is especially true of things like rates.

As I've written elsewhere, what unit of geography you use for urban analysis matters. Anytime anyone uses city boundaries, be suspicious. By cherry-picking cities (either within the nation, or within a metropolitan area), you can generate all sorts of spurious correlations, and really bias what your results are.

As I've written elsewhere, what unit of geography you use for urban analysis matters. Anytime anyone uses city boundaries, be suspicious. By cherry-picking cities (either within the nation, or within a metropolitan area), you can generate all sorts of spurious correlations, and really bias what your results are.
Urban Boundaries
Using cities for urban analysis is a joke. Travel behavior (commuting, shopping, traffic) doesn't stop at a city boundary. Cities are surrounded by suburbs, and suburbs are tied together by commuting flows. That's been recognized since the '70s, with the advent of Metropolitan Planning Organizations. Not to say that MPO boundaries are perfect. Metropolitan Areas are made up of county boundaries, and inclusion within an MPO is based on the urban commuter flows. Counties are large, and contain rural and urban parts--many analyses (notably of density) naively use county area totals. The best unit of analysis I know is the Federal Highway Urbanized Area boundary files. Sadly, each state prepares its own, and there is no central repository.
Randal O'Toole likes to cherrypick his examples.
"By comparison, the average speed of auto travel in most American cities is more than 30 mph. The slowest city is New York, at 17.6 mph, which helps explain why New York also has the highest rate of transit usage. The only others under 20 mph are San Francisco and Washington. At the other extreme, average speeds in Kansas City and Tulsa are more than 40 mph, probably because those cities, unlike so many others, haven’t actively tried to discourage driving in a doomed effort to get people to ride transit." - AntiPlanner
Comparing Tulsa to NYC is a joke. NYC has a population of 8.5 million; Tulsa has a population of barely 400,000. Which means NYC is 20 times larger.
O'Toole didn't present from the Texas Transportation Institute, which has data for the top 50 metropolitan areas. And guess what? The top 10 are all really congested!
It would be nice if Randal O'Toole could do more than take cheap shots.
It would be nice if Randal O'Toole could do more than take cheap shots. We would have better transit if we had thoughtful criticism of it. Instead, we have thoughtless criticism and uncritical boosterism.
This bit is mostly rhetoric--although he makes a few good points:
This bit is mostly rhetoric--although he makes a few good points:
- Trip chaining on transit is misery.
- The more kids you have, the more trip-chaining you have to do.
- The more time-sensitive 'emergency' trips you have to make.
- Running errands to arterial strip malls is misery.
- Getting groceries is tough.
- A wheeled shopping basket is really useful.
- Bike baskets are great
- Being able to Uber home is so worth it.
- Big suburban shopping malls are great to take the train to.
- Lots of shopping within a walkable distance.
- For less than half a mile, walking is usually faster.
- Putting transit stops too close together is stupid. 'Too close' is 400m, which is about 2 Salt Lake City blocks. Personally, I'd prefer 600m (3 blocks) because I think the 600 East and 900 East Trax stations are too close together. But I recognize not everyone is young and healthy.
- For any distance shorter than two miles, it's faster to bike.
- Weather matters. Rain, snow and ice can all be dealt with, but they do suck.
- Bikeway quality matters. I'll bike on anything, but my wife loves the protected bikeways. And with a kid in tow, so do I.
- "For most Americans, transit doesn’t serve the complexity of most of their adult lives"
- Nor does it need to. Transit doesn't have to be for everyone, all the time.
- It does offer a chance to cut down the miles that have to be driven, the cars that have to be owned, and the 'trips to fetch' that have to be made.
- Living in suburban Sandy, my mom took the train to work downtown for years. Saving (30 miles a day at 50 cents a mile) $15 a day, every day.
- My brothers and I took the train to University for years.
- My wife and I owned two cars, then one car, then no cars. I estimate that means we have 15% more of our income to spend on other things.
- No more sudden thousand dollar bills for car repairs.
Wednesday, May 31, 2017
What does Non-attainment actually mean?
If you hadn't heard, the Salt Lake and Provo area failed the last round of EPA air quality tests. It's not a big surprise--we've been just skating by for years. But what does that mean? Well, I asked my good friend Google, who directed me to the EPA website.
- All requirements above, with
- Major source threshold 50 tpy
- NSR offset ratio 1.2:1
- 18% RFP over 6 years
- Enhanced monitoring plan
- Modeled demo of attainment
- Milestone contingency measures for RFP
- Enhanced I/M
- Clean fuels program (if applicable)
- NSR requirements for existing source MODS
- Vehicle miles traveled (VMT) demonstration, and transportation control measures if needed
- All requirements above, with
- Major source threshold 50 tons per year
- New Source Review offset ratio 1.2:1
- 18% reasonable further progress over 6 years
- Enhanced monitoring plan
- Modeled demo of attainment
- Milestone contingency measures for Reasonable Further Progress
- Enhanced Inspection and Maintenance
- Clean fuels program (if applicable)
- New Source Review requirements for existing source MODS
- Vehicle miles traveled demonstration, and transportation control measures if needed
'Major Source' I presume to mean any single polluter emitting more than 50 tons a year of anything gets hassled; hence, any major single company is going to have a hard time (which may make them reluctant to come to Utah, or stay here).
'New Source Review' covers new polluters; they can pollute, if they can obtain 'offsets' by reducing pollutants from other sources. We're now at a 1.2:1 ratio, so for every 5 tons of new pollutant a New Source would emit, they have to find a way to reduce 6 tons of pollutant someplace else.
'18% Reasonable Further Progress' seems to indicate that while we don't have to fix the air quality immediately, we will need to demonstrate serious effort to do so; that serious effort being an amount of reduction in the next 6 years; ie, 18% of the total necessary reduction. 'Milestone Contingency' measures is related to this--things that we agree to do if we fail the 18% reasonable Further Progress.
VMT & 'Transportation Control Measure' is the scary one: It's a mandatory 'hard cap' on the amount of driving people are allowed to do. (57% of emissions in Salt Lake come from vehicles, I seem to recall). Crazy things like 'alternate day driving'.
All this makes me wonder how other places are doing: Current Non-Attainment Counties,
In 'Serious' Non-attainment.
AZ: Maricopa, Pinal
CA: Fresno, Imperial, Inyo, Kern, King, Los Angeles, Madera, Merced, Orange, San Bernardino, Riverside, San Joaquin, Stanislaus, Tulare, Ventura..
In 'Severe' Non-attainment:
CA: El Dorado, Los Angeles, Placer, Riverside, Sacramento, San Bernardino, Solano, Sutter, Yolo.
In 'Severe' Non-attainment:
CA: Fresno, Kern, King, Los Angeles, Madera, Merced, Orange, Riverside, San Bernadino, San Joaquin, Stanislaus, Tulare.
I don't think any of these are part of a club that Utah wants to be part of. Barring two counties in AZ, these are all in California. The California Air Resources Board (CARB) can do some pretty draconian things.
Oh, and if Utah (for mad reason) elects not to comply with air quality standards, we don't get our share of the Federal Gas Tax funds. Which pays for 50-80% of all roadway and transit projects. (80% for freeways). So, without that money, the amount Utah taxpayers would have to pay our per freeway QUINTUPLES.
Non-Attainment and Future Transit in Utah
Found this on SkyScraperForum. Fascinating.
Posted May 3, 2017, 3:55 PM, by Makid
I hate to cheer when my home state is about to take a punch to the gut, but....Serious Non-Attainment is no laughing matter.
Posted May 3, 2017, 3:55 PM, by Makid
..Coming back to the part above about the State possibly providing funds for Trax. I do think that the increased talk we have seen about Trax to Lehi/Utah County in the Legislature increase further. It may not be the next session but I do think that 2019 or 2020 the State will need to step in and probably force the Proposition 1 increase in Utah and SL Counties (if the counties haven't yet passed it).
The State would do this with the intention of bringing Trax to Lehi/Utah County as well as Trax extending towards the relocated prison. This will also bring Trax through the International Center as well as through the Inland Port (Probably #1 or #2 topic of the 2018 session).
I do think that the State will also directly provide funding to additional transit along the Wasatch Front soon. This is mostly due to the EPA classifying the majority of the area as a Serious Non-Containment Area. If the designation doesn't change soon, the State will lose funding for Roads and be forced to pass all laws that other states have enacted to improve air quality. This may include some of the statewide transit authorizations that some states have passed to help with air quality...
....without additional transit funding and usage, Utah will have the same air quality regulations and laws that California has....Dedicated Transit Funding, Stronger Limits on Emissions for all vehicles as well as Industries (MagCorp), Limits on Mining and air particles (Rio Tinto, Point of Mountain (North and South), and Limits on Coal Power emissions. These are the minimum that could be forced on the State by 2020...
I hate to cheer when my home state is about to take a punch to the gut, but....Serious Non-Attainment is no laughing matter.
Thursday, May 25, 2017
"The bottom line is money"
"The bottom line is money. Developers always want to squeeze more units"
Any developer for who money isn't the bottom line isn't a developer for long. Per square foot of construction, more units generate more rents. Two studios generate $600 a month, vs. $900 for a 2-bedroom, for the same floor-space. Three and four bedroom apartments are almost non-existent for this reason.
The only way to get a 3-4 bedroom place in the city is either to buy an hold house, or buy a condo. Houses are attractive, because they can always be expanded by 'sweat equity', at some later time.
Semi-Public and Public Spaces
"Developers always want to squeeze more units without open space for gathering and mingling."
The inclusion of 'gathering and mingling' spaces in multi-family tends to be a function of the market--ie, when rents are falling, developers start competing on amenities. You can mandate the inclusion of these amenities by regulation. And, when the market is strong, developers can and will bear these costs. But bearing those costs requires spreading them over a larger number of units. Which means one of two things happen: The only structures that get built are very large multi-family units, or that the average number of bedrooms per unit falls.
Historically, the 'mingling' spaces of urban places have been semi-public spaces: Hallways, alleyways, small streets, and the plazas where two streets intersect at odd angles. Larger spaces (plazas, squares, parks) tend to be public, and publicly owned. Perhaps density added through infill of multi-family on single family lots should be charged a 'park fee' per unit, and that money used to provide more parks.
New York has managed to carve out a number of plazas by permitting developers to add the square footage 'lost' by doing so to the top of the building, although that has some limitations due to elevator capacity.
Waiting For Transit
"Service frequency determines the average wait time for transit, and thus much of the overall travel time for a trip"
Q: Reallly? People spend that much time waiting for transit?
A: Not average trip time, average wait time. Wait time, however, is a substantial portion of many transit trips, and the part of the trip people hate worst. The lit says that riders treat a minute of wait as the same as multiple minutes of in vehicle time. Many UTA buses (especially in Utah County) run at 20, 30 or 60 minute headways. Once you include the amount of time you have to wait when the bus is late, this can mean substantial waits. Given that people choose transit based largely on its time competitiveness to the automobile, this is a significant issue. It's most significant for short trips. TRAX is frequent and (generally) reliable,. A 10 mile bus journey on a local bus is pretty miserable. WFRC likes to use 5-10 minutes for the wait, but I don't that that effectively reflects how miserable the experience is. It assumes people know where the bus stop is, how long it will take to walk there, and how long the wait will be. That is valid if you are taking the bus to work, once per day, but doesn't reflect the experience of using the bus for general transportation. The longer the headway, the higher the time-cost of missing a bus, so the more likely you are to leave your current location early to make sure your make it. If you have to use an (unreliable) bus connection to make that connection (such as bus to FrontRunner), there is even more waiting, because you can't control if you arrive 10 minutes early or 2 minutes too late, so you have to be 25 minutes early to be guaranteed a connection. Hence, I prefer to assume random arrival, at 1/2 headway, for any bus. This becomes increasingly important as UTA moves away from the '1-seat ride' model and toward the more efficient 'transfer network'.
Subscribe to:
Posts (Atom)